Evaluating the current system load with the program 'top' (Linux)
For Cloud Servers, migrated Cloud Servers, VPS, Dedicated Servers, and Server Power Deals
This article explains what information is displayed with the top program and which top commands you can use to monitor the current system load of your server.
You can use the top program to display system information as well as currently running processes. Additionally, it provides an interactive interface for manipulating processes and for individual configuration.
Most features can be selected either by interactive commands or by entries in the personal or system-wide configuration files.
Starting Top
To start top, enter the command top in the command line. You can combine this command with a variety of options/modifiers.
Information Displayed
In this example, you can see what information is listed in top:
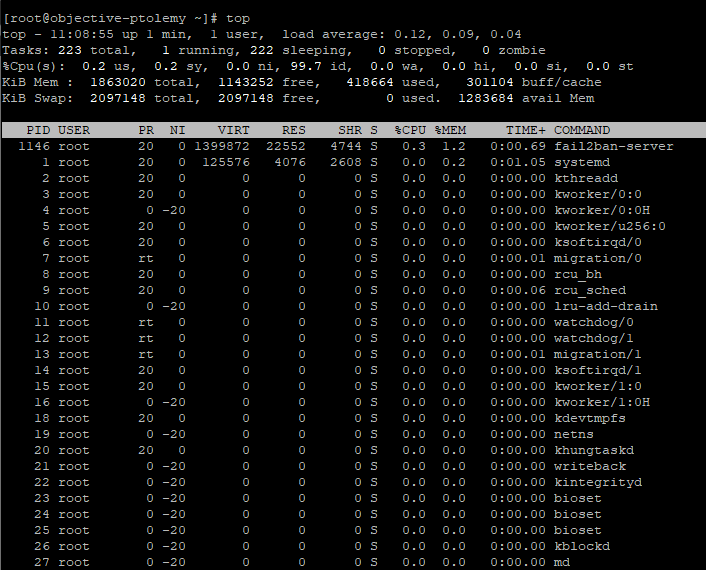
After entering the top command, the following information is displayed in the first line:
System Time: The system time that is set on the server
Up: How long the system has been running
User: The number of users logged on
Load Average: The average system load for the last 1, 5, and 15 minutes
Tasks: The total number of running processes
%Cpu(s): The usage of the CPU in percent. The following abbreviations are used in this line:
| Abbreviation | Stands for | Meaning |
|---|---|---|
| us | user | Time used by the un-"nice"-th user processes |
| sy | system | Time used by the kernel processes |
| ni | nice | Time used by the nice user processes |
| id | idle | Amount of time the system spends idle |
| wa | IO-wait | Time spent waiting for data processing. This information can also indicate disk speed bottlenecks. |
| hi | hardware interrupt | Time used to process hardware interrupts |
| si | software interrupt | Time used for handling software interrupts |
| st | steal time | Time that is "stolen" from the running virtual machine by the hypervisor for other tasks |
The following values are displayed in the process line:
| Abbreviation | Meaning |
|---|---|
| PID | Process ID |
| USER | User who started the process |
| PR | Priority scheduling |
| NI | The nice value of this process: A negative value means higher priority. A positive value means lower priority. |
| VIRT | The total amount of virtual memory used by the task, which includes all code, data, shared libraries, and paged pages. In addition, it includes pages for which usage has been planned, but which are not currently in use. |
| RES | Part of physical memory that has not been swapped out |
| SHR | Space that could be shared with other processes |
| S | Status of the process. These are the corresponding statuses: D = uninterruptible sleep, R = running, S = sleeping, T = traced or stopped, Z = zombie. |
| %CPU | Processor time in percent used for this process |
| %MEM | Amount of available physical memory currently used by the process |
| TIME+ | Processor time used by the process since startup |
| COMMAND | Name of the command |
Interactive Commands
The following is a list of important interactive commands.
| Key or key combination | Function |
|---|---|
| h | Open help |
| u | Display processes of a specific user |
| k | End process. You will then be asked for the PID of the process and the signal number. |
| r | Set the nice value of a process. You will then be asked for the PID and the nice value. |
| d | Set update interval in seconds. You will be asked for the waiting time (in seconds). |
| f | Add new fields to the display or remove existing ones. |
| n | Set maximum number of processes displayed. |
| N | Sort tasks by PID. |
| P | Sort task by CPU usage. |
| M | Sort task by RAM usage. |
| q | end top |
You can find more information about top here:
https://linux.die.net/man/1/top
For a further, more in-depth analysis of the system load, you can use the program atop. You can find more information about atop here: