How to find the median
In statistics, large data sets are usually only significant if they are processed and analysed appropriately after they are collected. The calculation of the median is an important part of this procedure. When you calculate the median, you reduce your data to one (or few) figures, so that complex relationships or facts can be clearly presented in the form of tables and diagrams. We explain how to find and interpret the median step by step.
What is the median?
The median, also called the central value, is the middle value of several measurements after data is ordered by size. In descriptive statistics, the median is also called the position parameter and is used to express the central tendency of the data set.
The median should not be confused for the average or mean value. Namely, this is calculated by adding up all the values and dividing it by the number of values. With the median, you focus on the central value of a collection of numbers.
How do you calculate the median?
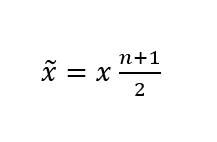
When calculating the median of a data series, there are two formulas that you can use, depending on the number of observed values. The general symbol for median is x ̃ (pronounced ‘x snake’ or ‘x tilde’), n stands for the number of observed values and x stands for a value from the data series.
If you have an odd number of observation values, use the following formula:
Read on for a more in-depth explanation of both options.
How to find the median
Example 1: Odd number of values
In our first example, you have an odd number of observed values. Imagine 11 participants at a training seminar are asked about their age and their answers are as follows:
28, 34, 51, 19, 62, 43, 29, 38, 45, 26, 49
First, sort the answers into ascending order:
19, 26, 28, 29, 34, 38, 43, 45, 49, 51, 62
Each value now stands for a certain x-value. That is, 19 = , 26 = , 28 = , etc. The advantage of an odd number of observations is that you can now read the median directly. In this case, it is = 38, since this value divides the series of numbers in half. Here, one half of ages (19, 26, 28, 29, 34) is smaller than the median and the other half (43, 45, 49, 51, 62) is larger than the median.
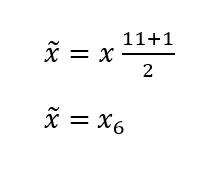
You can find the median by applying the relevant formula. represents the number of observed values – in our case 11. The formula is:
Since is 38, we get the same result. Therefore, the median of the age data is 38, since this value lies in the middle after data is ordered by value (usually ascending).
Example 2: Even number of values
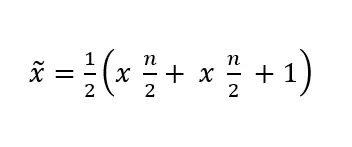
In the case of an even number of values, the median is not quite as easy to find because the median is not at a central position in the data series.
Let’s pretend another candidate joins our seminar for a total of 12 participants. Their ages now are:
28, 34, 51, 19, 62, 43, 29, 38, 45, 26, 49, 33
When you sort their answers from small to large, the number series from to is:
19, 26, 28, 29, 33, 34, 38, 43, 45, 49, 51, 62
With = 12, the formula for even observation values is applied:
Thus, the median for the seminar age data is 36.
If you work with the spreadsheet program Excel, you don’t need to calculate the median manually. Excel offers a handy median function to calculate the median quickly and error-free.
Difference to arithmetic mean and mode
As mentioned, the median should not be confused with the mean or average. Also referred to as the arithmetic mean, it is used when the average value of data needs to be found. In our first example, the average age would be 38.5 (the sum of the data divided by the number of participants). The mode is another term often used in statistics. It indicates the most frequent value in a dataset. In our example, every number is a mode, because each value is unique.
Use of the median
So when should you calculate the median and in which cases are the arithmetic mean or mode more suitable?
This depends entirely on the situation. Although the arithmetic mean is generally considered more precise and very efficient in statistics, it is also more sensitive to outliers. This means that one incorrect measurement in a data set can distort the average. Although the median is not as precise or as efficient as the arithmetic mean, it is considered more robust and is therefore often used when data sets are contaminated.
The mode, on the other hand, is used when you are not dealing with numerical values but non-numerical features. For example, the mode would be useful if you sell a product in different colours and want to find out which colour is the most popular.


